Radio Wave
RWC is a time-cycle model that simulates market behavior as if it were a radio wave. Instead of relying on traditional trend or oscillator logic, the algorithm converts time into mathematical wave structures, revealing the underlying rhythm and timing patterns of the market.
Description
The market behaves much like a physical wave, characterized by frequencies, overlaps, reversals, and sub-cycles. The RWC indicator delivers a scientific, signal-driven method for accurately detecting the market’s “timing tones.”
This indicator puts the concept into motion:
Simulates market movement as radio waves.
Calculates rising and falling wave phases for precise cycle analysis.
Generated waves highlight hidden intra-wave patterns for deeper market insight.
By aligning the start date and wavelength, the engine reconstructs how the market behaves as a signal carrier—revealing the dominant path that governs price movement.
The algorithm blends wave simulation with customizable backtesting, enabling users to evaluate signals, performance, and trade behavior directly on the chart.

Amit, Lead Developer & Market Strategist at AlgoFuego
Features

Wave Simulation
Simulates market movement as radio waves. Calculates rising and falling wave phases for precise cycle analysis. Generated waves highlight hidden intra-wave patterns for deeper market insight. The engine reconstructs how the market behaves as a signal carrier—revealing the dominant path that governs price movement.
Backtesting & Trade Simulation
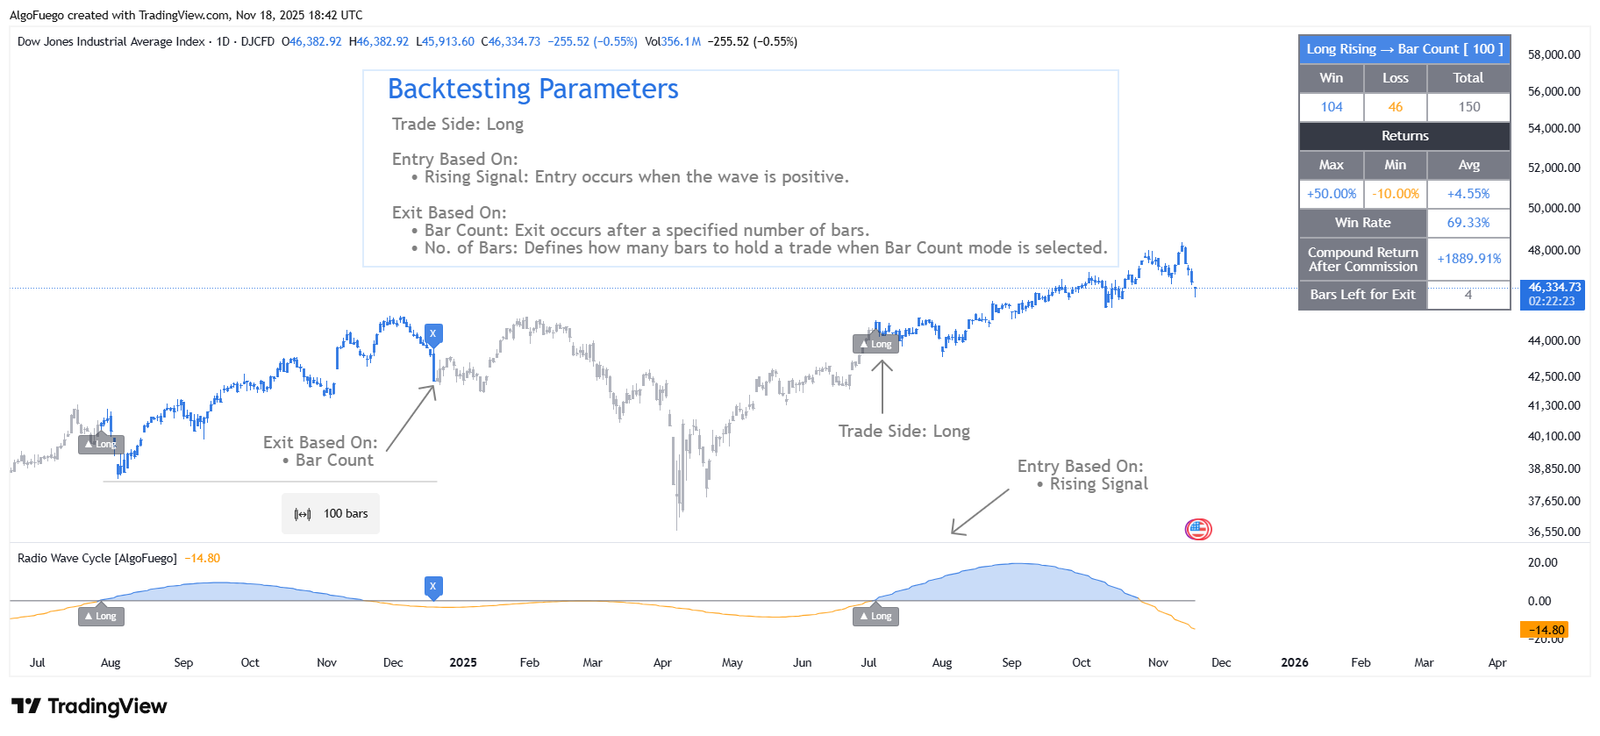
Supports Long or Short trade simulation. Configurable entry and exit triggers to define trade conditions. Optional stop-loss and take-profit levels (percentage-based). Tracks cumulative returns, with or without accounting for commission.
Trade Visualization
Entry, exit, stop-loss, and target levels displayed on chart. Configurable label sizes and colors. Candle coloring based on trade direction (long/short/neutral).
Performance Metrics
Signal Type: Shows the backtest configuration (Trade Side + Entry → Exit type). Number of Trades: Total, win, and loss trades executed. Returns: Displays maximum, minimum, and average trade returns. Win Rate: Percentage of profitable trades. Compound Return: • Before or after commission, depending on settings. • Displays the compounded growth of total equity across all trades. Bars Left Showing how many bars remain until the trade is closed.
Alerts
Create alerts based on trade events. Entry: Triggers when a new trade entry signal is generated. StopLoss: Triggers when the price reaches the stop-loss level. Target: Triggers when the price hits the take-profit target. Exit: Triggers when the position is closed by an exit signal. Each alert type can be enabled or disabled individually.
Settings Overview
RWC (Radio Wave Cycle) Settings
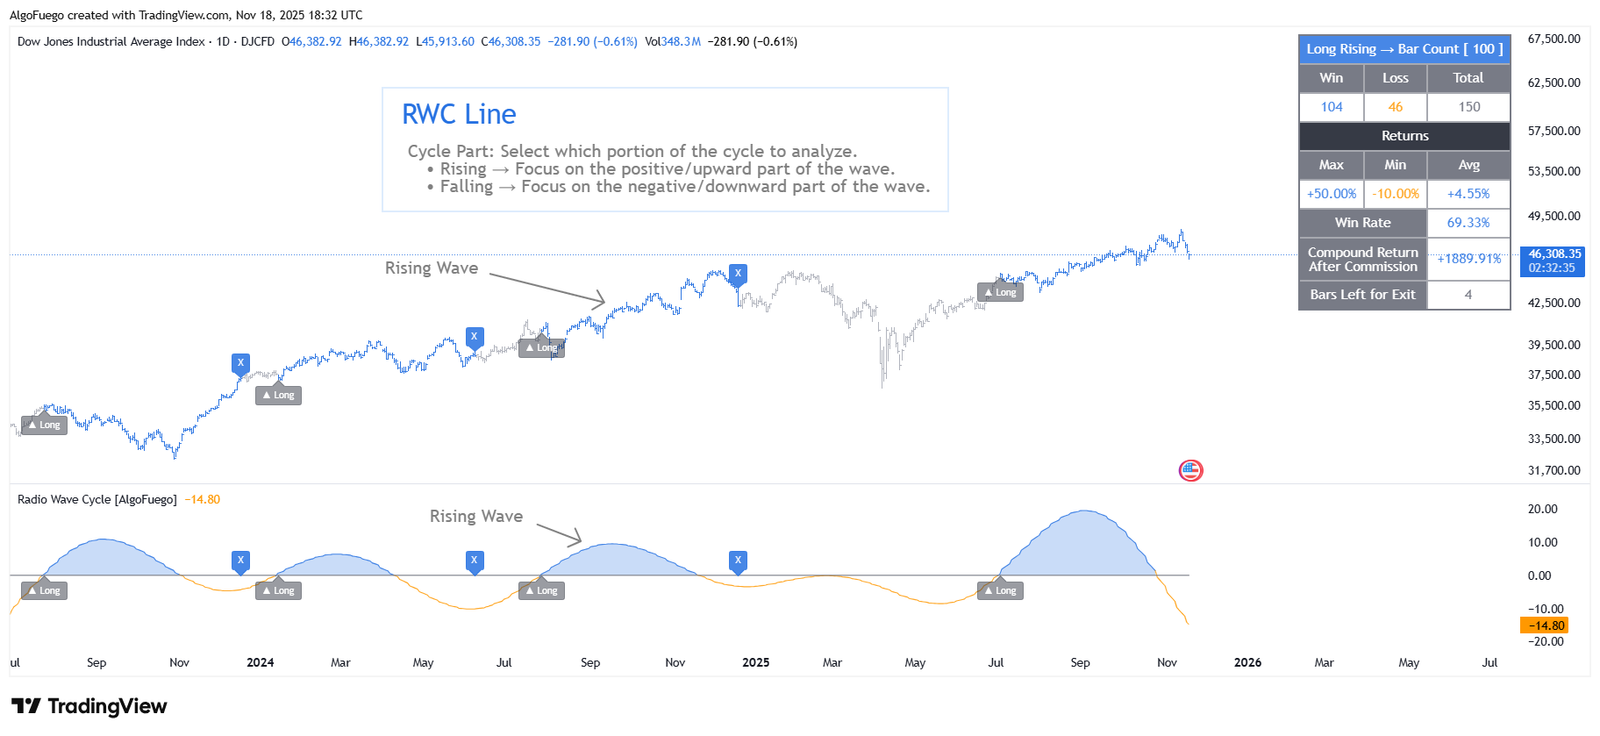
Define the cycle structure by setting the start date, base wave length, number of cycles, step value, and the cycle part (Rising or Falling) to analyze specific market phases.
Backtesting & Trade Simulation
Control how trades are entered and exited by selecting trade direction (Long or Short), entry signals (Rising or Falling wave), and exit logic (Wave reversal or fixed bar count).
Trade & Risk Management
Configure stop-loss and take-profit levels, enable visual trade markers, and adjust label sizes for clear trade tracking.
Commission Simulation
Apply entry and exit commission percentages to simulate realistic trading costs during backtesting.
Bar Color Settings
Enable dynamic candle coloring to clearly distinguish long, short, and neutral market conditions.

How to Use
Choose a meaningful start date to anchor the cycle calculations.
Select the base number and the number of cycles to determine the wave length based on the path.
Pick the wave direction (Rising or Falling) to analyze market movement.
Turn on Trade Settings, Alerts, and Commission for a more realistic simulation.
Once activated, trade markers, colored candles, and the statistics table will appear automatically.
Use the displayed metrics to assess performance and optimize your cycle parameters.
Exclusive Offer : 30 Day Free Trial!
Sign up today and start using our premium tools risk-free for 30 days. Get the insights you need to make better trading decisions.