Radio Wave

Introduction
Radio Wave [AlgoFuego] is a unique market timing indicator that reimagines price behavior as a mathematical wave, treating time and cyclical movement as the core drivers of trend dynamics rather than relying solely on price patterns or conventional technical tools.
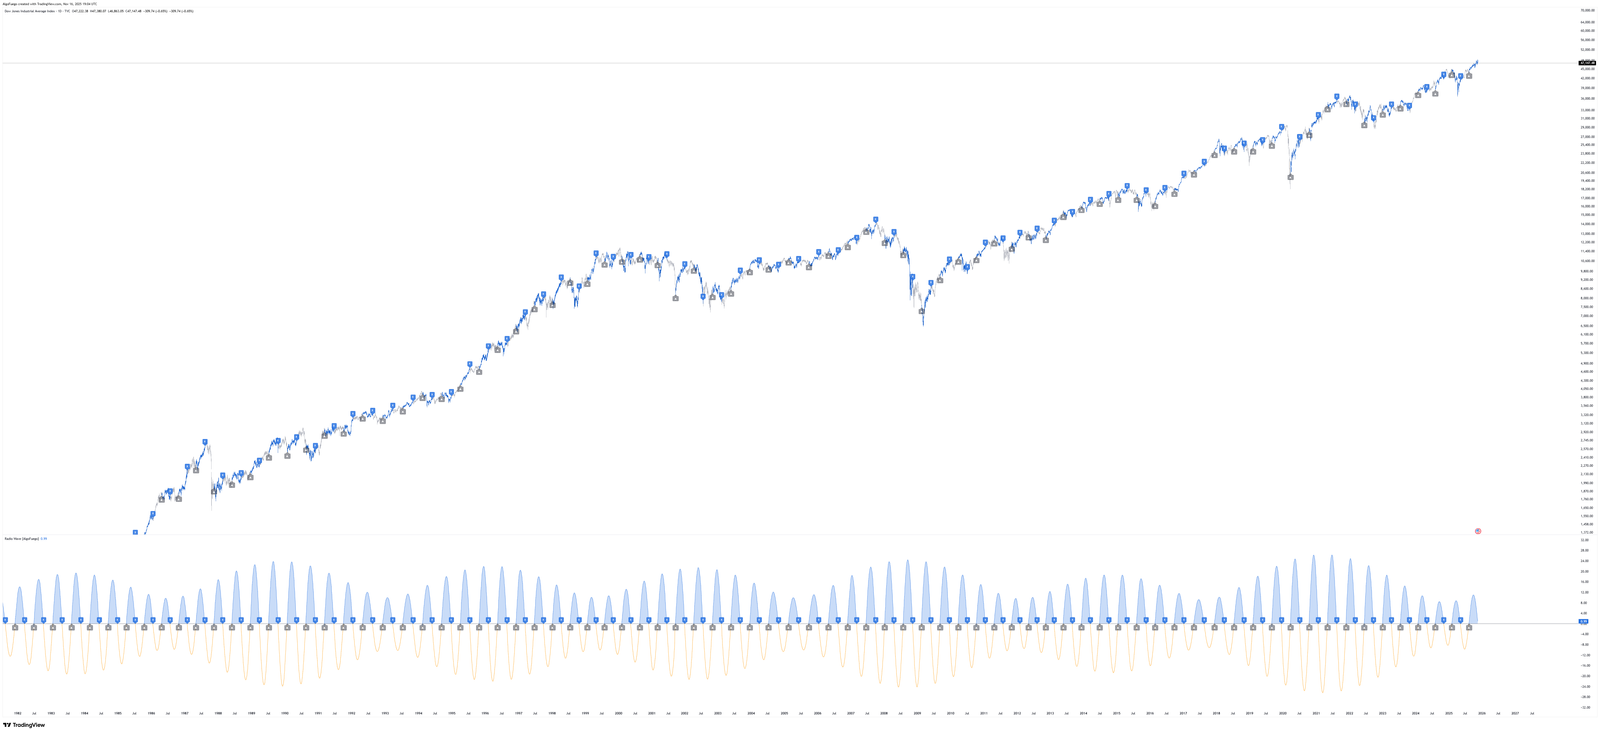
At its essence, the Radio Wave Cycle (RWC) indicator models market movement much like a physical radio wave—where cycles rise and fall in predictable patterns. By converting time into wave structures, it reveals hidden rhythm‑based opportunities and generates signals rooted in cyclical behavior.
Wave‑Driven Market Interpretation
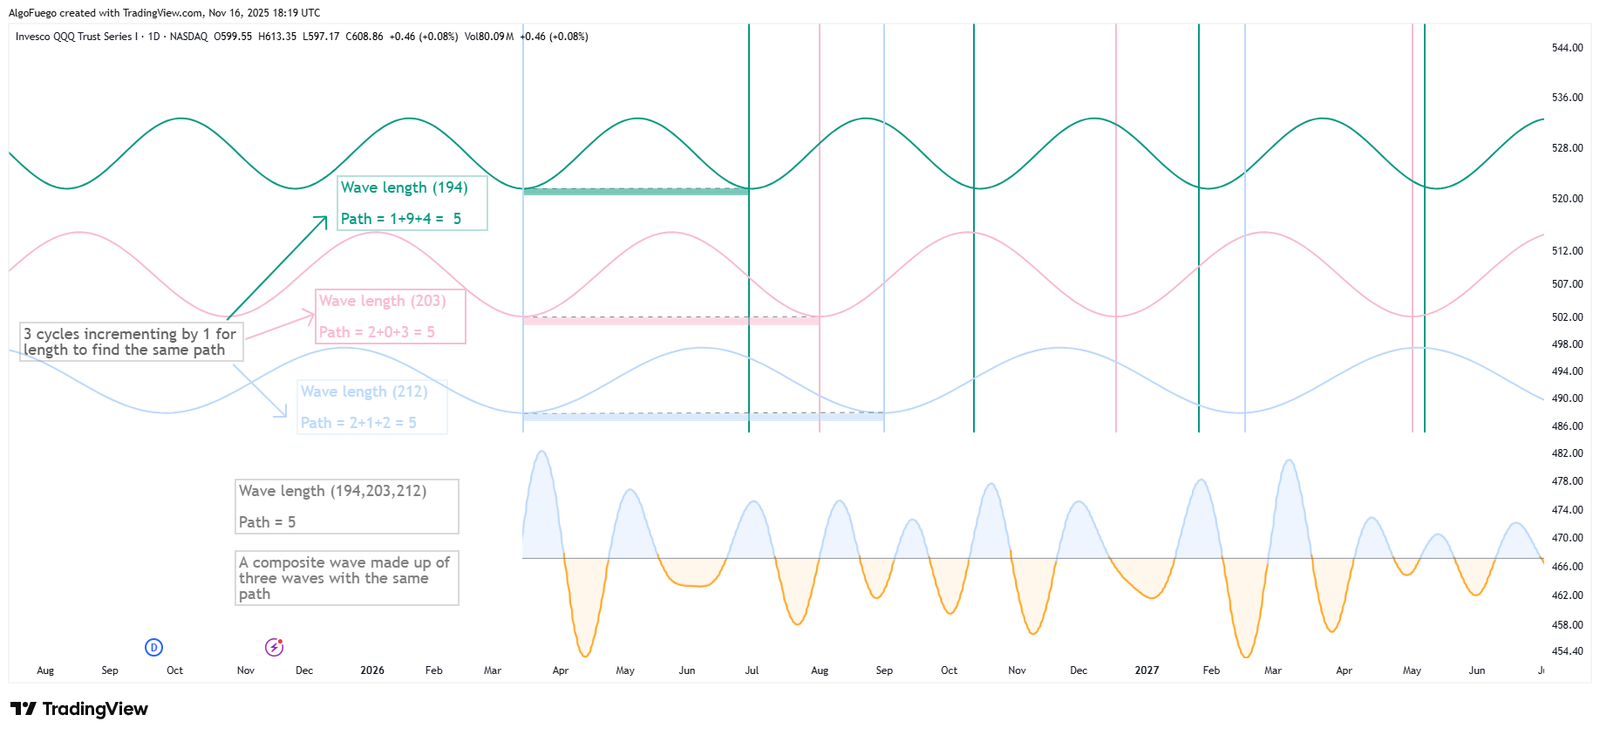
Traditional indicators focus on price levels, momentum, or trend confirmation. Radio Wave takes a different approach: it assumes the market behaves like overlapping cycles of varying wavelengths. Using sine wave mathematics, it combines multiple generated cycles to form a unified wave that approximates the market’s dominant rhythm.
From this composite wave, the tool identifies rising and falling phases—which serve as the basis for Long and Short signals. By anchoring all cycle calculations to a chosen start date and wavelength, the indicator produces a simulated wave that reflects historical timing patterns.
Customizable Cycle Parameters
Radio Wave offers deep flexibility:
-
Start Date & Base Wave Length: Anchor the cycle simulation to a meaningful historical reference and define a core cycle duration.
-
Number of Cycles & Step Values: Combine multiple cycle layers and apply increments for refined wavelength alignment.
-
Cycle Phase Selection: Analyze either rising or falling portions of the condensed wave to match directional bias.
This setup allows traders to explore a broad range of cyclical patterns—from short‑term fluctuations to extended rhythmic trends.
Trade Simulation & Strategy Testing
Radio Wave integrates trade simulation capabilities that let users test and validate cycle‑based ideas directly on TradingView charts:
-
Signal‑Based Trade Generation: Signals are created when the wave enters rising or falling phases, generating Long or Short trade triggers.
-
Entry & Exit Logic: Trades can be exited on wave reversals or after a specified number of bars, enabling both rule‑based exits and time‑limited strategies.
-
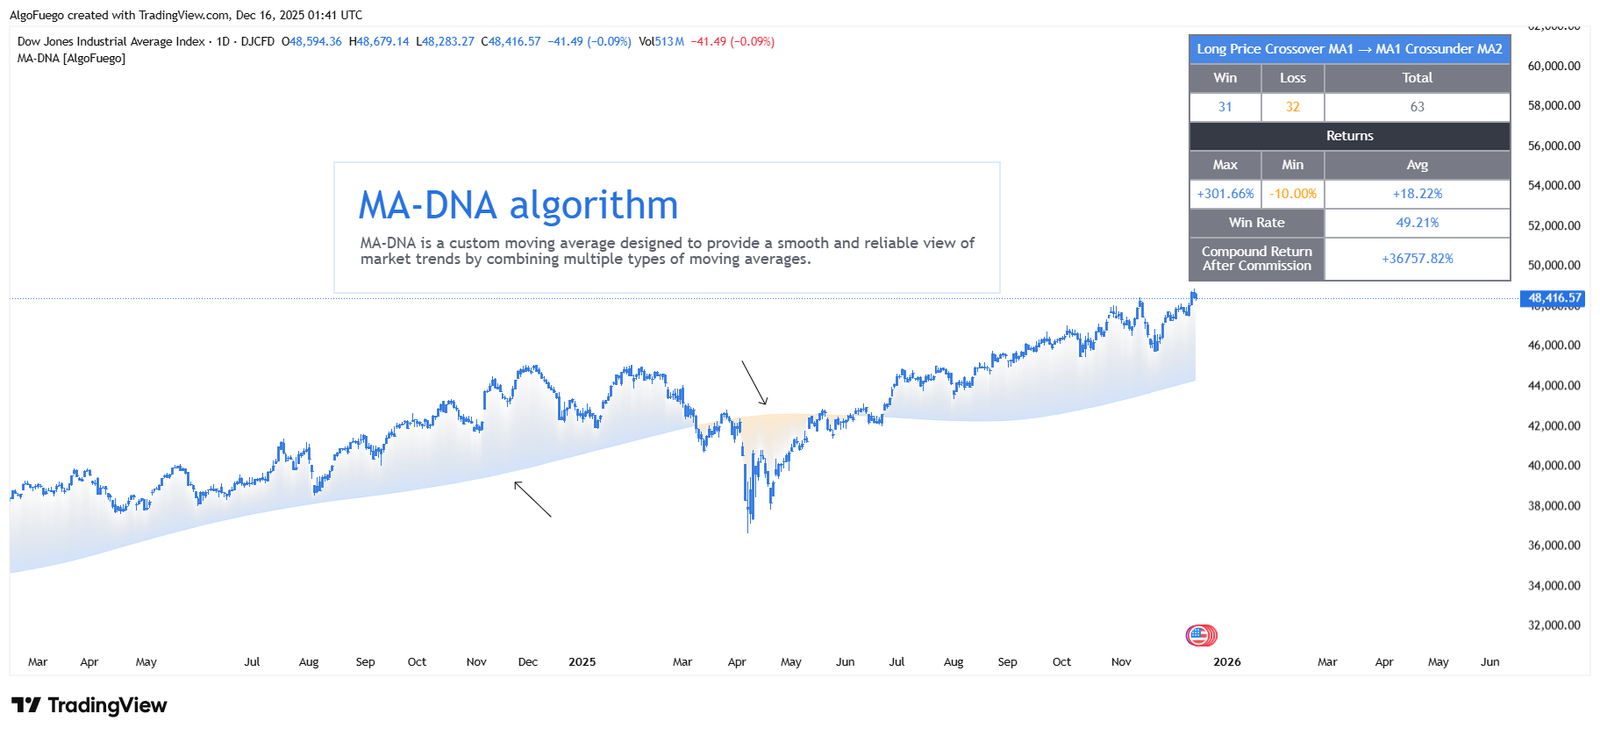
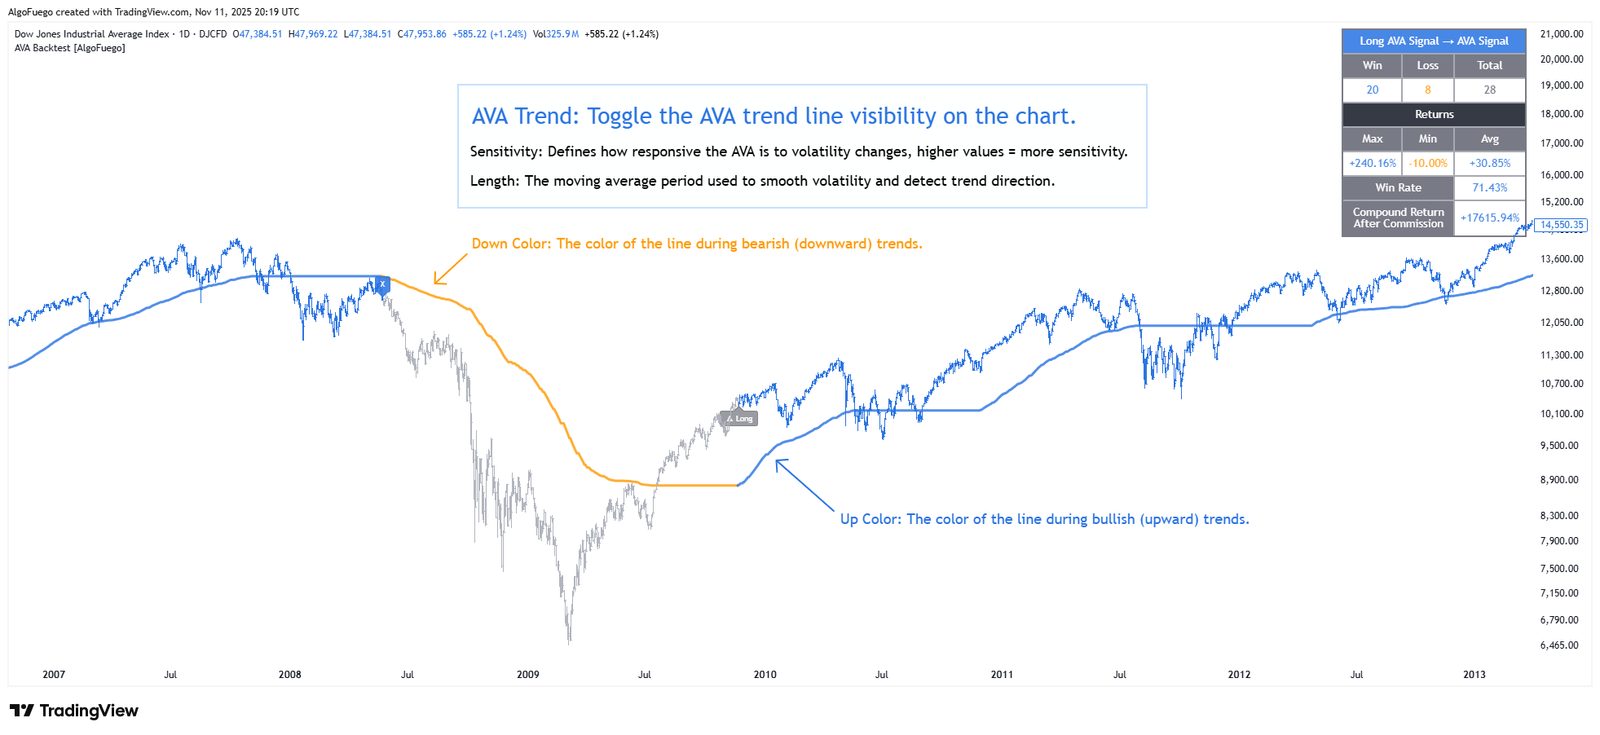
Performance Analytics: An embedded statistics table displays key metrics such as cumulative returns, win rate, and estimated remaining bars in open trades.
-
Risk Management: Optional stop‑loss, take‑profit, and commission inputs provide more realistic backtesting results and help tailor risk profiles.
These features make the indicator not just a signal engine, but also a backtesting platform for exploring how cyclic theory might translate into actionable strategies.
Visual Signals & Chart Enhancements
Radio Wave improves clarity through visual elements that help contextualize timing signals on price charts:
-
Wave Visualization: The underlying wave curve shows rising and falling cycle patterns overlaid with price.
-
Trade Markers & Labels: Entry, exit, stop‑loss, and target levels appear directly on the chart for intuitive analysis.
-
Candle Coloring: Price bars can be colored based on trade state or signal context, offering clear visual cues.
Together, these visual aids make it easier for traders to interpret the wave‑based signals and connect cycle theory with actual price movement.
Who Should Consider Radio Wave?
This indicator is particularly appealing to:
-
Traders interested in cycle analysis and market timing theory.
-
Analysts who want to augment traditional price‑based indicators with a time‑centric perspective.
-
Strategy developers exploring systematic methods based on mathematical cycle aggregates.
While cycle‑based models offer fresh insight, it’s important to remember that past cycle behavior doesn’t guarantee future performance. Users are encouraged to combine Radio Wave signals with sound risk management practices and broader market context.

19 Dec - 2025

Mo'men Jaradat, Senior Analyst & Market Strategist at AlgoFuego

181

Copy the link

Related Articles
30 Day Free Trial!
Sign up today and start using our premium tools risk-free for 30 days. Get the insights you need to make better trading decisions.
